
BTC/USD Swings Above $40,000 Resistance

Bitcoin Price Prediction – February 28
The Bitcoin price prediction shows that BTC may restart the uptrend after touching the daily high of $41,995.
BTC/USD Long-term Trend: Bearish (Daily Chart)
Key levels:
Resistance Levels: $48,000, $50,000, $52,000

Support Levels: $32,000, $30,000, $28,000
BTC/USD looks green today as the price hovers above the 9-day and 21-day moving averages. However, a daily close above the upper boundary of the channel may increase the Bitcoin price to the resistance level of $45,000. Nevertheless, traders should note that a consistent price increase may bring more buyers into the market as bulls increase their positions.
Bitcoin Price Prediction: Price May Initiate a Price Hike
According to the daily chart, after the Bitcoin price touches the daily high of $41,995, the first digital asset is now looking forward to touching another resistance level of $42,000. Therefore, if the red-line of the 9-day moving average crosses above the green-line of the 21-day moving average, this will keep the first digital asset on the positive side.
On the contrary, bears may bring the market price back below the 9-day moving average if the bulls fail to push it to the upside. Meanwhile, the technical indicator Relative Strength Index (14) is likely to cross above 60-level which could take the king coin to the resistance levels of $48,000, $50,000, and $52,000 but if the market price retreats and move towards the lower boundary of the channel, it may bring the price to the supports at $32,000, $30,000, and $28,000.

BTC/USD Medium – Term Trend: Ranging (4H Chart)
According to the 4-hour chart, the Bitcoin price is hovering above the 9-day and 21-day moving averages as the king coin moves toward the upper boundary of the channel which could reach the resistance level at $45,000 and above.
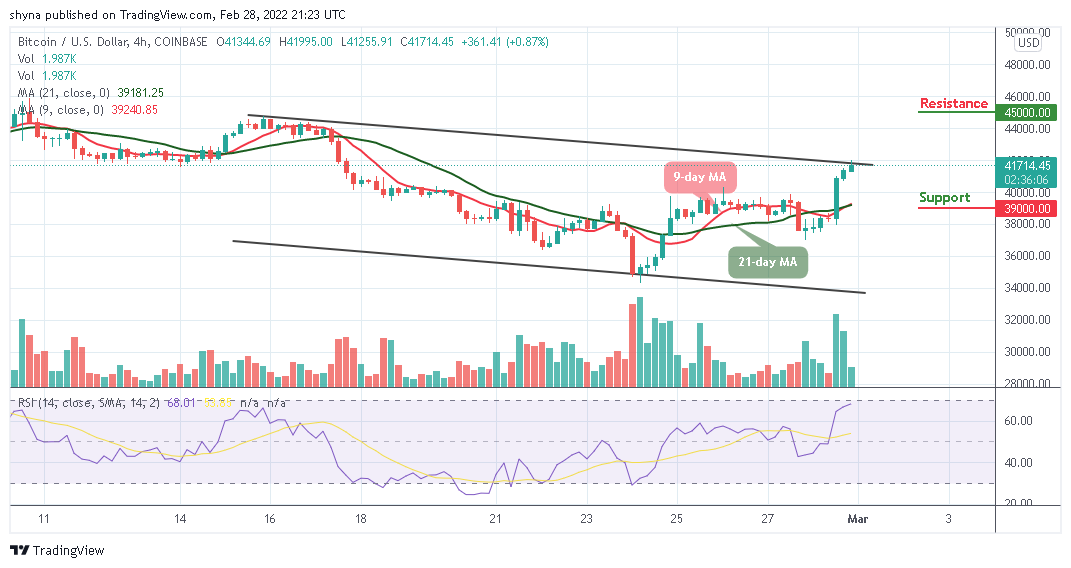
On the contrary, if the sellers drag the market downward, traders can expect a fall below the 9-day and 21-day moving averages, and breaking this barrier could bring the price to hit the support level of $39,000 and below. Meanwhile, the technical indicator Relative Strength Index (14) is likely to cross into the overbought region, suggesting more bullish signals.
Looking to buy or trade Bitcoin (BTC) now? Invest at eToro!
68% of retail investor accounts lose money when trading CFDs with this provider
Read more: